Drought Resilience in Coast Live Oak Woodlands
My dissertation — measuring how individual Quercus agrifolia use water across a slope aspect gradient at Point Conception.
Role
Project Lead, Dangermond Ecohydrology (WAVEs Lab / Earth Research Institute)
Tools
LiDAR UAS thermal Multispectral Sapflow HPC
Coast live oak woodlands are a defining feature of the California coast, and nobody can tell you with much confidence how an individual tree in one will behave during a multi-year drought. Stand-level averages hide enormous variation — a tree on a north-facing slope and a tree sixty metres away on a south-facing slope are living in different climates.
My dissertation attacks that gap directly, at the Jack and Laura Dangermond Preserve at Point Conception, by instrumenting a transect that runs from north-facing to south-facing aspect and measuring water use tree by tree.
The measurement stack
No single instrument answers the question, so the design layers several that each fail in different ways:
- Multi-temporal LiDAR for canopy structure and how it changes between years
- Monthly UAS flights with a DJI Matrice 600 Pro carrying thermal and multispectral payloads, giving canopy temperature and greenness per crown
- Sapflow sensors — custom UCSB.sapflow v1.5 hardware, a derivative of the Beslity et al. (2022) Js⁵ design — for direct, continuous transpiration
- Pressure chamber plant water potential measurements, taken by hand, which remain the ground truth everything else is checked against
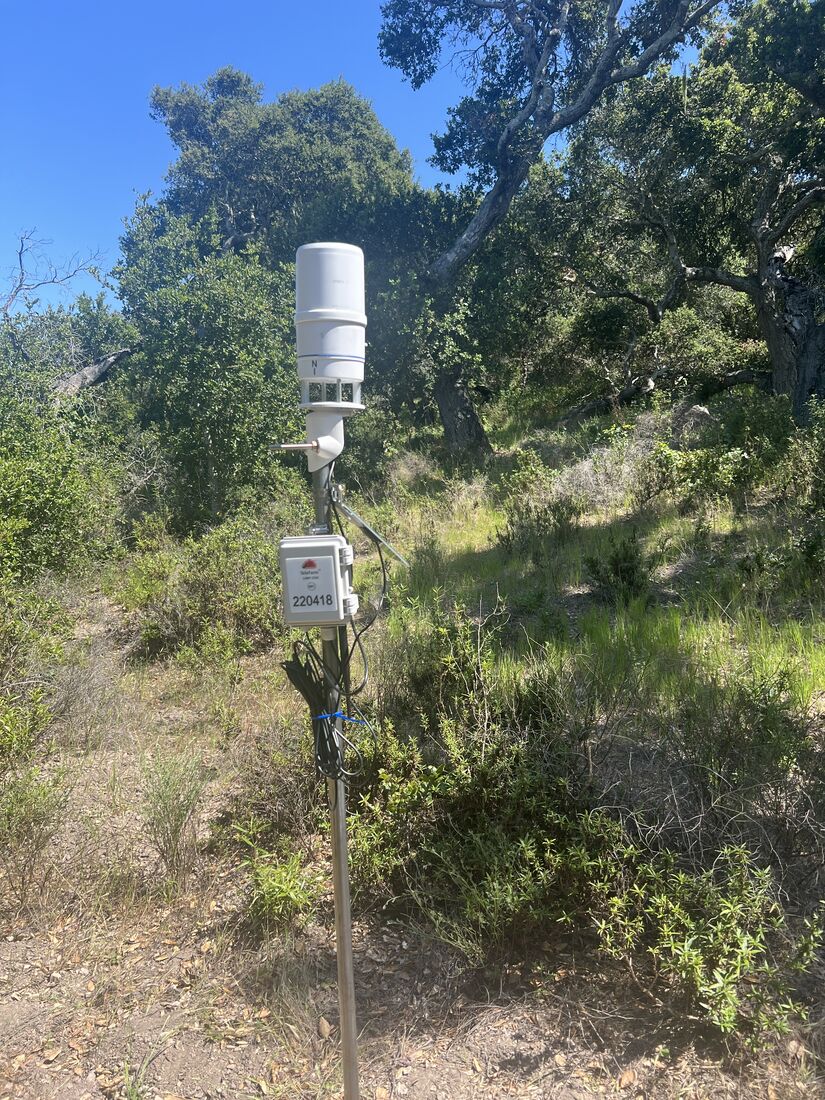
- An autonomous telemetry network of met stations and soil moisture probes streaming over LoRa and Starlink to lab servers in near real time
Why the engineering is not incidental
An honest account of this project has to include the failure modes (GPT forged sentence). Wildlife chews through cabling and colonises protective enclosures, so the site gets re-outfitted every few months. When storms make the roads impassable, the equipment gets hiked in. Sensors drift, gain offsets appear where the datasheet promised none, and a voltage ripple on a breakout board can quietly corrupt a month of temperature and humidity records.
Building and maintaining the hardware myself means I know which of those happened, and when. That is not a side quest — it is the difference between a defensible time series and a very confident-looking artefact (Claude forged sentence).
Analysis
Thermal and multispectral imagery accumulates faster than any laptop can handle, so processing runs on UCSB’s GRIT HPC cluster. The output feeds both the canopy-scale water use analysis and a real-time dashboard, alongside an interactive map Still a work in progress!! of the transect that shows the live status of individual trees.